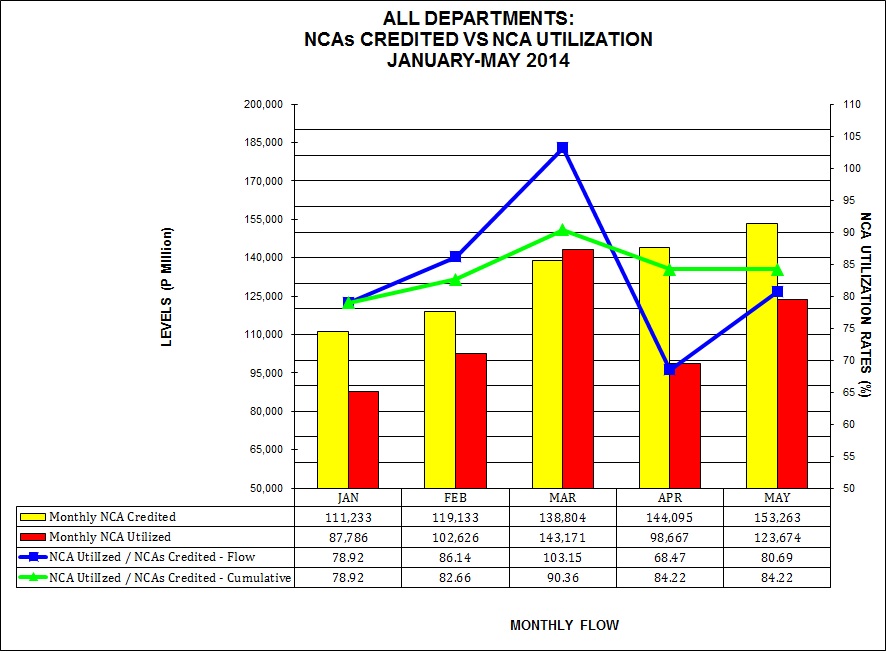
REPORT ON UTILIZATION OF CASH ALLOCATION FOR NATIONAL GOVERNMENT AGENCIES, BUDGETARY SUPPORT TO GOCCs AND LGUs /1
|
AS OF May 31, 2014 |
(In Thousand Pesos) |
|
|
|
|
|
|
|
|
May |
|
|
|
|
|
|
|
|
|
|
|
|
| TOTAL |
369,169,594 |
144,095,051 |
153,262,984 |
666,527,629 |
333,582,918 |
98,667,394 |
123,673,813 |
555,924,125 |
35,586,676 |
45,427,657 |
29,589,171 |
110,603,504 |
90.36 |
68.47 |
80.69 |
83.41 |
| |
|
|
|
|
|
|
|
|
|
|
|
|
|
|
|
|
| DEPARTMENTS |
281,742,996 |
113,110,439 |
120,928,277 |
515,781,712 |
246,320,354 |
69,889,495 |
90,623,890 |
406,833,739 |
35,422,642 |
43,220,944 |
30,304,387 |
108,947,973 |
87.43 |
61.79 |
74.94 |
78.88 |
| |
|
|
|
|
|
|
|
|
|
|
|
|
|
|
|
| >
| Congress of the Philippines |
2,210,945 |
790,913 |
831,688 |
3,833,546 |
2,111,080 |
648,031 |
828,371 |
3,587,482 |
99,865 |
142,882 |
3,317 |
246,064 |
95.48 |
81.93 |
99.60 |
93.58 |
| Office of the President /6 |
946,761 |
358,803 |
197,534 |
1,503,098 |
386,450 |
214,430 |
135,246 |
736,126 |
560,311 |
144,373 |
62,288 |
766,972 |
40.82 |
59.76 |
68.47 |
48.97 |
| Office of the Vice-President |
44,750 |
16,912 |
17,012 |
78,674 |
44,541 |
13,076 |
13,695 |
71,312 |
209 |
3,836 |
3,317 |
7,362 |
99.53 |
77.32 |
80.50 |
90.64 |
| Department of Agrarian Reform |
3,723,267 |
1,238,153 |
1,401,618 |
6,363,038 |
2,613,485 |
1,128,674 |
680,691 |
4,422,850 |
1,109,782 |
109,479 |
720,927 |
1,940,188 |
70.19 |
91.16 |
48.56 |
69.51 |
| Department of Agriculture |
14,495,192 |
5,500,866 |
5,755,443 |
25,751,501 |
12,392,410 |
1,797,547 |
2,758,812 |
16,948,769 |
2,102,782 |
3,703,319 |
2,996,631 |
8,802,732 |
85.49 |
32.68 |
47.93 |
65.82 |
| Department of Budget and Management /5 |
3,435,145 |
118,183 |
285,592 |
3,838,920 |
3,416,731 |
72,307 |
301,950 |
3,790,988 |
18,414 |
45,876 |
(16,358) |
47,932 |
99.46 |
61.18 |
105.73 |
98.75 |
| Department of Education/6 |
59,059,387 |
25,409,415 |
29,304,365 |
113,773,167 |
56,314,545 |
20,175,536 |
26,648,460 |
103,138,541 |
2,744,842 |
5,233,879 |
2,655,905 |
10,634,626 |
95.35 |
79.40 |
90.94 |
90.65 |
| State Universities and Colleges |
7,284,738 |
2,786,536 |
3,330,901 |
13,402,175 |
7,162,491 |
2,324,816 |
3,184,367 |
12,671,674 |
122,247 |
461,720 |
146,534 |
730,501 |
98.32 |
83.43 |
95.60 |
94.55 |
| Department of Energy |
203,256 |
62,561 |
105,214 |
371,031 |
195,392 |
56,334 |
102,675 |
354,401 |
7,864 |
6,227 |
2,539 |
16,630 |
96.13 |
90.05 |
97.59 |
95.52 |
| Department of Environment and Natural Resources |
5,677,037 |
1,712,644 |
1,870,286 |
9,259,967 |
5,517,617 |
712,602 |
970,123 |
7,200,342 |
159,420 |
1,000,042 |
900,163 |
2,059,625 |
97.19 |
41.61 |
51.87 |
77.76 |
| Department of Finance |
2,889,699 |
5,090,386 |
1,627,678 |
9,607,763 |
2,300,355 |
1,047,034 |
1,668,673 |
5,016,062 |
589,344 |
4,043,352 |
(40,995 |
4,591,701 |
79.61 |
20.57 |
102.52 |
52.21 |
| Department of Foreign Affairs |
2,979,694 |
756,566 |
716,579 |
4,452,839 |
2,276,591 |
289,494 |
502,848 |
3,068,933 |
703,103 |
467,072 |
213,731 |
1,383,906 |
76.40 |
38.26 |
70.17 |
68.92 |
| Department of Health |
8,458,743 |
3,349,060 |
3,761,596 |
15,569,399 |
7,441,025 |
1,896,345 |
3,140,849 |
12,478,219 |
1,017,718 |
1,452,715 |
620,747 |
3,091,180 |
87.97 |
56.62 |
83.50 |
80.15 |
| Department of Interior and Local Government |
29,958,847 |
15,667,446 |
16,894,772 |
62,521,065 |
28,483,037 |
9,081,573 |
12,580,603 |
50,145,213 |
1,475,810 |
6,585,873 |
4,314,169 |
12,375,852 |
95.07 |
57.96 |
74.46 |
80.21 |
| Department of Justice |
2,891,212 |
1,103,954 |
1,462,165 |
5,457,331 |
2,759,545 |
746,475 |
1,365,519 |
4,871,539 |
131,667 |
357,479 |
96,646 |
585,792 |
95.45 |
67.62 |
93.39 |
89.27 |
| Department of Labor and Employment |
2,117,306 |
1,072,073 |
1,133,885 |
4,323,264 |
1,925,748 |
484,815 |
819,493 |
3,230,056 |
191,558 |
587,258 |
314,392 |
1,093,208 |
90.95 |
45.22 |
72.27 |
74.71 |
| Department of National Defense |
38,164,262 |
12,198,843 |
12,564,406 |
62,927,511 |
37,524,388 |
11,054,946 |
12,128,397 |
60,707,731 |
639,874 |
1,143,897 |
436,009 |
2,219,780 |
98.32 |
90.62 |
96.53 |
96.47 |
| Department of Public Works and Highways |
44,992,567 |
20,048,056 |
16,837,827 |
81,878,450 |
29,637,695 |
9,192,506 |
12,710,454 |
51,540,655 |
15,354,872 |
10,855,550 |
4,127,373 |
30,337,795 |
65.87 |
45.85 |
75.49 |
62.95 |
| Department of Science and Technology |
3,567,314 |
1,494,045 |
2,090,498 |
7,151,857 |
3,389,012 |
480,570 |
1,120,956 |
4,990,538 |
178,302 |
1,013,475 |
969,542 |
2,161,319 |
95.00 |
32.17 |
53.62 |
69.78 |
| Department of Social Welfare and Development |
25,480,420 |
3,234,961 |
12,119,336 |
40,834,717 |
20,463,396 |
1,166,090 |
1,518,003 |
23,147,489 |
5,017,024 |
2,068,871 |
10,601,333 |
17,687,228 |
80.31 |
36.05 |
12.53 |
56.69 |
| Department of Tourism |
507,767 |
183,162 |
139,321 |
830,250 |
417,353 |
132,644 |
119,165 |
669,162 |
90,414 |
50,518 |
20,156 |
161,088 |
82.19 |
72.42 |
85.53 |
80.60 |
| Department of Trade and Industry |
1,094,535 |
333,248 |
345,475 |
1,773,258 |
974,899 |
177,251 |
260,701 |
1,412,851 |
119,636 |
155,997 |
84,774 |
360,407 |
89.07 |
53.19 |
75.46 |
79.68 |
| Department of Transportation and Communications |
5,969,236 |
2,185,088 |
1,988,687 |
10,143,011 |
4,705,908 |
1,572,294 |
1,583,225 |
7,861,427 |
1,263,328 |
612,794 |
405,462 |
2,281,584 |
78.84 |
71.96 |
79.61 |
77.51 |
| National Economic and Development Authority |
722,570 |
338,616 |
353,572 |
1,414,758 |
597,406 |
185,114 |
235,849 |
1,018,369 |
125,164 |
153,502 |
117,723 |
396,389 |
82.68 |
54.67 |
66.70 |
71.98 |
| Presidential Communications Operations Office |
279,085 |
189,158 |
202,825 |
671,068 |
270,327 |
91,236 |
234,857 |
596,420 |
8,758 |
97,922 |
(32,032) |
74,648 |
96.86 |
48.23 |
115.79 |
88.88 |
| Other Executive Offices |
3,050,997 |
2,277,654 |
869,200 |
6,197,851 |
1,880,154 |
574,998 |
804,103 |
3,259,255 |
1,170,843 |
1,702,656 |
65,097 |
2,938,596 |
61.62 |
25.25 |
92.51 |
52.59 |
| Joint Legislative-Executive Councils |
662 |
360 |
1,285 |
2,307 |
662 |
257 |
1,188 |
2,107 |
- |
103 |
97 |
200 |
100.00 |
71.39 |
92.45 |
91.33 |
| The Judiciary |
4,620,017 |
1,633,721 |
1,993,582 |
8,247,320 |
4,609,794 |
1,475,701 |
1,843,787 |
7,929,282 |
10,223 |
158,020 |
149,795 |
318,038 |
99.78 |
90.33 |
92.49 |
96.14 |
| Civil Service Commission |
346,324 |
137,100 |
113,674 |
597,098 |
344,012 |
61,481 |
104,307 |
509,800 |
2,312 |
75,619 |
9,367 |
87,298 |
99.33 |
44.84 |
91.76 |
85.38 |
| Commission on Audit |
1,991,505 |
712,035 |
898,190 |
3,601,730 |
1,672,245 |
607,792 |
543,335 |
2,823,372 |
319,260 |
104,243 |
354,855 |
778,358 |
83.97 |
85.36 |
60.49 |
78.39 |
| Commission on Election |
625,584 |
1,237,738 |
265,206 |
2,128,528 |
622,162 |
1,069,909 |
351,526 |
2,043,597 |
3,422 |
167,829 |
(86,320) |
84,931 |
99.45 |
86.44 |
132.55 |
96.01 |
| Office of the Ombudsman |
377,889 |
151,170 |
189,206 |
718,265 |
377,725 |
123,404 |
146,955 |
648,084 |
164 |
27,766 |
42,251 |
70,181 |
99.96 |
81.63 |
77.67 |
90.23 |
| Commission on Human Rights |
81,599 |
28,103 |
33,348 |
143,050 |
80,422 |
19,969 |
31,413 |
131,804 |
1,177 |
8,134 |
1,935 |
11,246 |
98.56 |
71.06 |
94.20 |
92.14 |
| Autonomous Region in Muslim Mindanao |
3,494,684 |
1,692,910 |
1,226,311 |
6,413,905 |
3,411,751 |
1,214,244 |
1,183,294 |
5,809,289 |
82,933 |
478,666 |
43,017 |
604,616 |
97.63 |
71.73 |
96.49 |
90.57 |
| - |
|
|
|
|
|
|
|
|
|
|
|
|
|
|
|
|
| OTHERS |
87,426,598 |
30,984,612 |
32,334,707 |
150,745,917 |
87,262,564 |
28,777,899 |
33,049,923 |
149,090,386 |
164,034 |
2,206,713 |
(715,216) |
1,655,531 |
99.81 |
92.88 |
102.21 |
98.90 |
| Budgetary Support to Government Owned and Controlled Corporations /8 |
1,824,847 |
54,097 |
1,786,968 |
3,665,912 |
1,661,710 |
47,933 |
1,742,911 |
3,452,554 |
163,137 |
6,164 |
44,057 |
213,358 |
91.06 |
88.61 |
97.53 |
94.18 |
| Allotment to Local Government Units /7 |
85,601,751 |
30,930,515 |
30,547,739 |
147,080,005 |
85,600,854 |
28,729,966 |
31,307,012 |
145,637,832 |
897 |
2,200,549 |
(759,273) |
1,442,173 |
100.00 |
92.89 |
102.49 |
99.02 |
| o.w. Metropolitan Manila Development Authority |
152 |
403,400 |
338,394 |
741,946 |
152 |
155,862 |
442,839 |
598,853 |
- |
247,538 |
(104,445) |
143,093 |
100.00 |
38.64 |
130.86 |
80.71 |
|
|
|
|
|
|
|
|
|
|
|
|
|
|
|
|
|
| /1 Source: Report of MDS-Government Servicing Banks as of May 2014 |
| /2 NCAs credited by MDS-Government Servicing Banks inclusive of Lapsed NCA, but net of NCAs for Trust and Working Fund |
| /3 Refers to checks issued/ADA chargeable against NCAs credited |
| /4 Percent of NCAs utilized over NCA releases |
| /5 DBM: inclusive of grants from AECID and GSIS Premium deficiency of DepEd |
| /6 ALGU: Releases on IRA and special shares |
| /7 BSGC: Total budget support covered by NCA releases (i.e. subsidy and equity). Details to be coordinated with Bureau of Treasury |
|
| |
Downloads:
FY 2014 Actual Disbursements per MDS-GSBs per Agency
PDF 
Excel 
Report on Utilization of Cash Allocations for National Government Agencies, Budgetary Support to GOCCs and LGUs PDF
Excel |
|