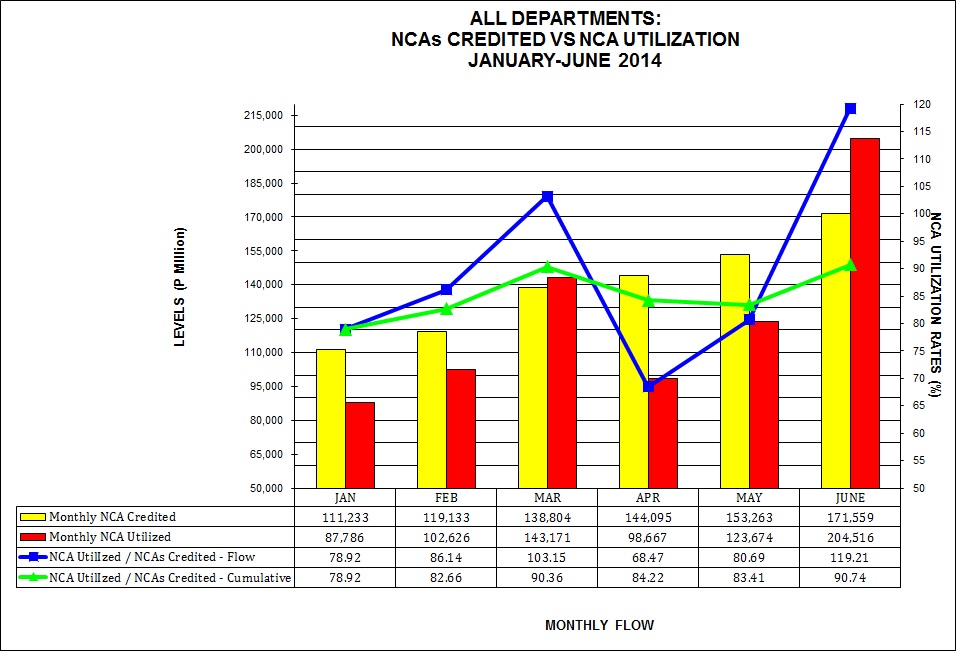
REPORT ON UTILIZATION OF CASH ALLOCATION FOR NATIONAL GOVERNMENT AGENCIES, BUDGETARY SUPPORT TO GOCCs AND LGUs /1
|
AS OF JUNE 2014 |
(In Thousand Pesos) |
|
|
|
|
|
|
|
Q2 |
|
|
|
|
|
|
|
|
|
| TOTAL |
369,169,594 |
468,917,420 |
838,087,014 |
333,582,918 |
426,857,355 |
760,440,273 |
35,586,676 |
42,060,065 |
77,646,741 |
90.4 |
91.0 |
90.7 |
| |
|
|
|
|
|
|
|
|
|
|
|
|
| DEPARTMENTS |
281,742,996 |
328,586,766 |
610,329,762 |
246,320,354 |
287,074,840 |
533,395,194 |
35,422,642 |
41,511,926 |
76,934,568 |
87.4 |
87.4 |
87.4 |
| |
|
|
|
|
|
|
|
|
|
|
|
|
| Congress of the Philippines |
2,210,945 |
2,390,051 |
4,600,996 |
2,111,080 |
2,390,023 |
4,501,103 |
99,865 |
28 |
99,893 |
95.5 |
100.0 |
97.8 |
| Office of the President |
946,761 |
737,725 |
1,684,486 |
386,450 |
461,168 |
847,618 |
560,311 |
276,557 |
836,868 |
40.8 |
62.5 |
50.3 |
| Office of the Vice-President |
44,750 |
49,480 |
94,230 |
44,541 |
40,308 |
84,849 |
209 |
9,172 |
9,381 |
99.5 |
81.5 |
90.0 |
| Department of Agrarian Reform |
3,723,267 |
4,931,173 |
8,654,440 |
2,613,485 |
2,910,637 |
5,524,122 |
1,109,782 |
2,020,536 |
3,130,318 |
70.2 |
59.0 |
63.8 |
| Department of Agriculture |
14,495,192 |
16,086,997 |
30,582,189 |
12,392,410 |
11,029,750 |
23,422,160 |
2,102,782 |
5,057,247 |
7,160,029 |
85.5 |
68.6 |
76.6 |
| Department of Budget and Management /5 |
3,435,145 |
1,549,574 |
4,984,719 |
3,416,731 |
1,525,668 |
4,942,399 |
18,414 |
23,906 |
42,320 |
99.5 |
98.5 |
99.2 |
| Department of Education |
59,059,387 |
74,434,849 |
133,494,236 |
56,314,545 |
70,124,880 |
126,439,425 |
2,744,842 |
4,309,969 |
7,054,811 |
95.4 |
94.2 |
94.7 |
| State Universities and Colleges |
7,284,738 |
8,631,422 |
15,916,160 |
7,162,491 |
8,494,747 |
15,657,238 |
122,247 |
136,675 |
258,922 |
98.3 |
98.4 |
98.4 |
| Department of Energy |
203,256 |
231,880 |
435,136 |
195,392 |
231,332 |
426,724 |
7,864 |
548 |
8,412 |
96.1 |
99.8 |
98.1 |
| Department of Environment and Natural Resources |
5,677,037 |
6,209,782 |
11,886,819 |
5,517,617 |
4,782,071 |
10,299,688 |
159,420 |
1,427,711 |
1,587,131 |
97.2 |
77.0 |
86.6 |
| Department of Finance |
2,889,699 |
8,343,262 |
11,232,961 |
2,300,355 |
7,494,493 |
9,794,848 |
589,344 |
848,769 |
1,438,113 |
79.6 |
89.9 |
87.2 |
| Department of Foreign Affairs |
2,979,694 |
2,155,814 |
5,135,508 |
2,276,591 |
1,097,547 |
3,374,138 |
703,103 |
1,058,267 |
1,761,370 |
76.4 |
50.9 |
65.7 |
| Department of Health |
8,458,743 |
10,547,515 |
19,006,258 |
7,441,025 |
8,997,325 |
16,438,350 |
1,017,718 |
1,550,190 |
2,567,908 |
88.0 |
85.3 |
86.5 |
| Department of Interior and Local Government |
29,958,847 |
41,696,061 |
71,654,908 |
28,483,037 |
40,655,478 |
69,138,515 |
1,475,810 |
1,040,583 |
2,516,393 |
95.1 |
97.5 |
96.5 |
| Department of Justice |
2,891,212 |
3,530,792 |
6,422,004 |
2,759,545 |
3,339,864 |
6,099,409 |
131,667 |
190,928 |
322,595 |
95.4 |
94.6 |
95.0 |
| Department of Labor and Employment |
2,117,306 |
3,496,121 |
5,613,427 |
1,925,748 |
2,864,532 |
4,790,280 |
191,558 |
631,589 |
823,147 |
91.0 |
81.9 |
85.3 |
| Department of National Defense |
38,164,262 |
39,733,375 |
77,897,637 |
37,524,388 |
38,993,263 |
76,517,651 |
639,874 |
740,112 |
1,379,986 |
98.3 |
98.1 |
98.2 |
| Department of Public Works and Highways |
44,992,567 |
50,914,541 |
95,907,108 |
29,637,695 |
39,500,242 |
69,137,937 |
15,354,872 |
11,414,299 |
26,769,171 |
65.9 |
77.6 |
72.1 |
| Department of Science and Technology |
3,567,314 |
4,751,561 |
8,318,875 |
3,389,012 |
4,294,136 |
7,683,148 |
178,302 |
457,425 |
635,727 |
95.0 |
90.4 |
92.4 |
| Department of Social Welfare and Development |
25,480,420 |
19,111,635 |
44,592,055 |
20,463,396 |
12,362,947 |
32,826,343 |
5,017,024 |
6,748,688 |
11,765,712 |
80.3 |
64.7 |
73.6 |
| Department of Tourism |
507,767 |
895,965 |
1,403,732 |
417,353 |
843,463 |
1,260,816 |
90,414 |
52,502 |
142,916 |
82.2 |
94.1 |
89.8 |
| Department of Trade and Industry |
1,094,535 |
968,673 |
2,063,208 |
974,899 |
880,554 |
1,855,453 |
119,636 |
88,119 |
207,755 |
89.1 |
90.9 |
89.9 |
| Department of Transportation and Communications |
5,969,236 |
5,873,759 |
11,842,995 |
4,705,908 |
4,921,374 |
9,627,282 |
1,263,328 |
952,385 |
2,215,713 |
78.8 |
83.8 |
81.3 |
| National Economic and Development Authority |
722,570 |
965,508 |
1,688,078 |
597,406 |
667,470 |
1,264,876 |
125,164 |
298,038 |
423,202 |
82.7 |
69.1 |
74.9 |
| Presidential Communications Operations Office |
279,085 |
479,925 |
759,010 |
270,327 |
476,901 |
747,228 |
8,758 |
3,024 |
11,782 |
96.9 |
99.4 |
98.4 |
| Other Executive Offices |
3,050,997 |
3,942,989 |
6,993,986 |
1,880,154 |
2,330,715 |
4,210,869 |
1,170,843 |
1,612,274 |
2,783,117 |
61.6 |
59.1 |
60.2 |
| Joint Legislative-Executive Councils |
662 |
1,866 |
2,528 |
662 |
1,588 |
2,250 |
- |
278 |
278 |
100.0 |
85.1 |
89.0 |
| The Judiciary |
4,620,017 |
5,137,424 |
9,757,441 |
4,609,794 |
4,850,719 |
9,460,513 |
10,223 |
286,705 |
296,928 |
99.8 |
94.4 |
97.0 |
| Civil Service Commission |
346,324 |
343,209 |
689,533 |
344,012 |
339,360 |
683,372 |
2,312 |
3,849 |
6,161 |
99.3 |
98.9 |
99.1 |
| Commission on Audit |
1,991,505 |
2,253,748 |
4,245,253 |
1,672,245 |
2,110,164 |
3,782,409 |
319,260 |
143,584 |
462,844 |
84.0 |
93.6 |
89.1 |
| Commission on Election |
625,584 |
1,711,841 |
2,337,425 |
622,162 |
1,715,208 |
2,337,370 |
3,422 |
(3,367) |
55 |
99.5 |
100.2 |
100.0 |
| Office of the Ombudsman |
377,889 |
464,549 |
842,438 |
377,725 |
464,307 |
842,032 |
164 |
242 |
406 |
100.0 |
99.9 |
100.0 |
| Commission on Human Rights |
81,599 |
86,298 |
167,897 |
80,422 |
86,607 |
167,029 |
1,177 |
(309) |
868 |
98.6 |
100.4 |
99.5 |
| Autonomous Region in Muslim Mindanao |
3,494,684 |
5,927,402 |
9,422,086 |
3,411,751 |
5,795,999 |
9,207,750 |
82,933 |
131,403 |
214,336 |
97.6 |
97.8 |
97.7 |
| - |
|
|
|
|
|
|
|
|
|
|
|
|
| OTHERS |
87,426,598 |
140,330,654 |
227,757,252 |
87,262,564 |
139,782,515 |
227,045,079 |
164,034 |
548,139 |
712,173 |
99.8 |
99.6 |
99.7 |
| Budgetary Support to Government Owned and Controlled Corporations/7 |
1,824,847 |
48,139,432 |
49,964,279 |
1,661,710 |
48,127,239 |
49,788,949 |
163,137 |
12,193 |
175,330 |
91.1 |
100.0 |
99.6 |
| Allotment to Local Government Units/6 |
85,601,751 |
92,191,222 |
177,792,973 |
85,600,854 |
91,655,276 |
177,256,130 |
897 |
535,946 |
536,843 |
100.0 |
99.4 |
99.7 |
| o.w. Metropolitan Manila Development Authority |
152 |
1,107,540 |
1,107,692 |
152 |
1,107,536 |
1,107,688 |
- |
4 |
4 |
100.0 |
100.0 |
100.0 |
|
|
|
|
|
|
|
|
|
|
|
|
|
| /1 Source : Report of MDS-Government Servicing Banks as of June 2014 |
| /2NCAs credited by MDS-Government Servicing Banks inclusive of Lapsed NCA, but net of NCAs for Trust and Working Fund |
| /3Refers to checks issued/ADA chargeable against NCAs credited |
| /4 Percent of NCAs utilized over NCA releases |
| /5DBM: inclusive of grants from AECID and GSIS Premium deficiency of DepEd |
| /6ALGU: Releases on IRA and special shares |
| /7BSGC: Total budget support covered by NCA releases (i.e. subsidy and equity). Details to be coordinated with Bureau of Treasury |
|
| |
Downloads:
FY 2014 Actual Disbursements per MDS-GSBs per Agency
PDF 
Excel 
Report on Utilization of Cash Allocations for National Government Agencies, Budgetary Support to GOCCs and LGUs PDF
Excel |
|