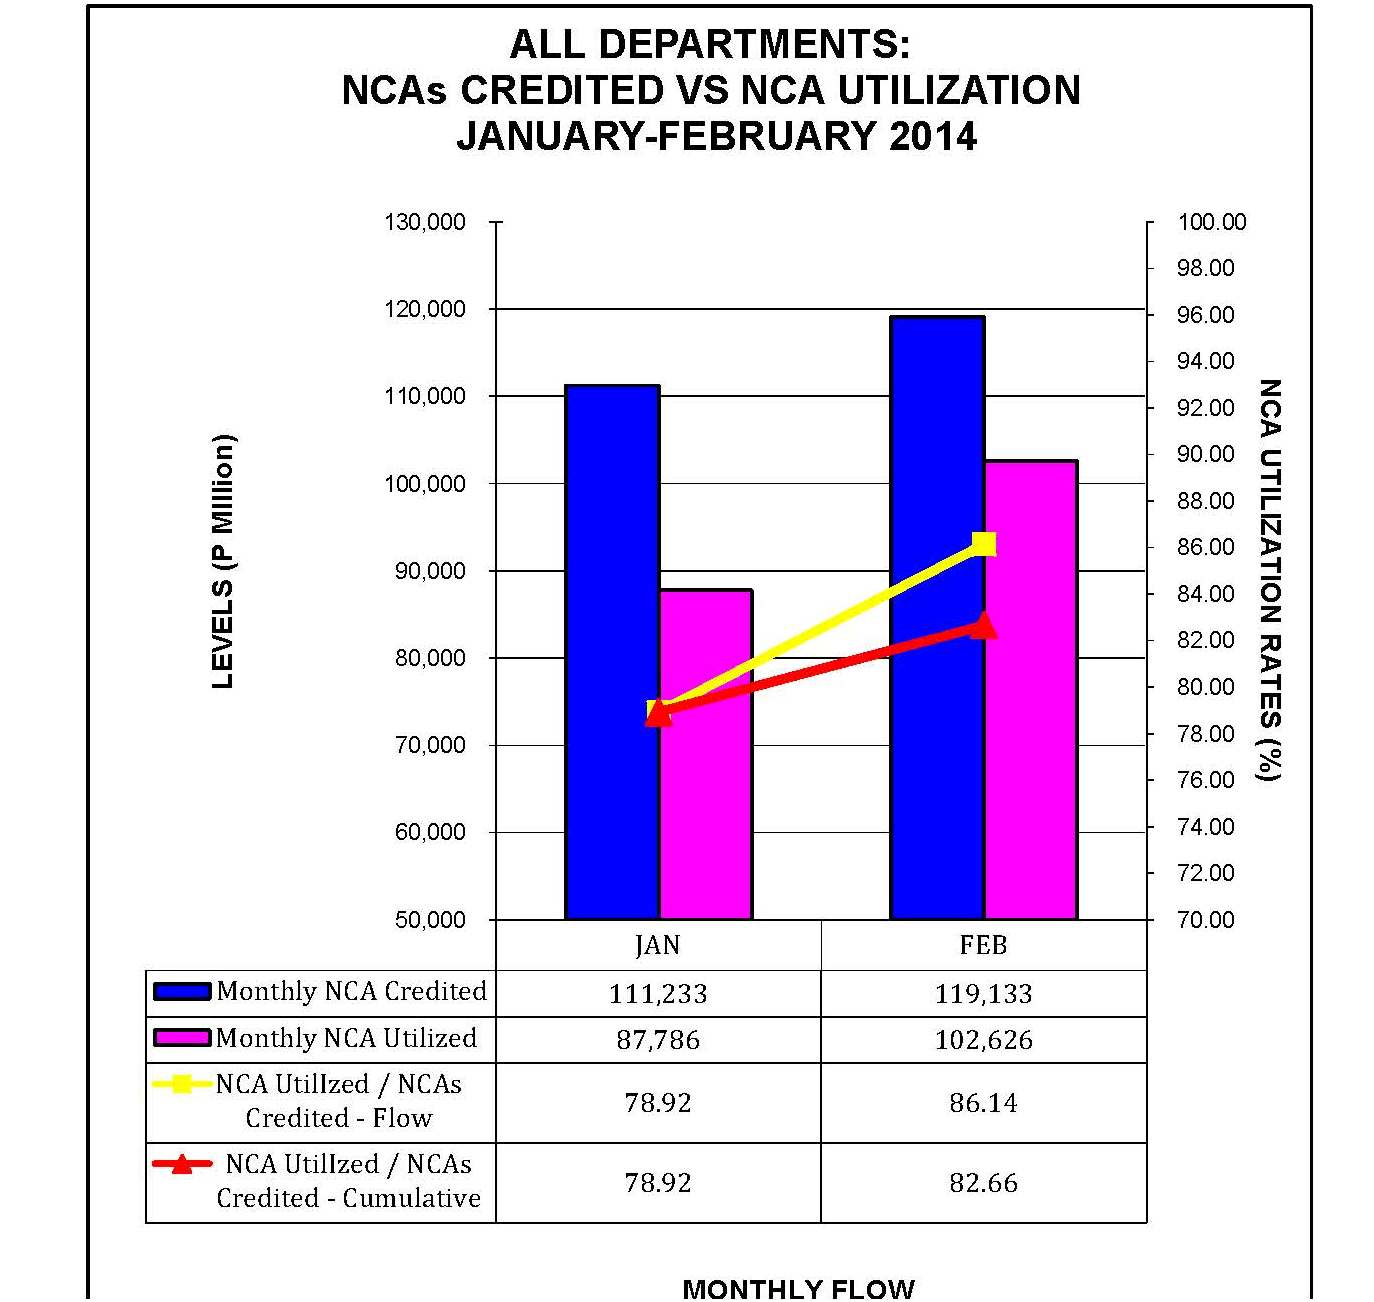
REPORT ON UTILIZATION OF CASH ALLOCATION FOR NATIONAL GOVERNMENT AGENCIES, BUDGETARY SUPPORT TO GOCCs AND LGUs /1
|
AS OF FEBRUARY 2014 |
(In Thousand Pesos) |
|
|
|
|
|
|
|
FEBRUARY |
|
|
|
|
|
|
|
|
|
| TOTAL |
111,232,740 |
119,133,219 |
230,365,959 |
87,785,988 |
102,625,817 |
190,411,805 |
23,446,752 |
16,507,402 |
39,954,154 |
78.9 |
86.1 |
82.7 |
| |
|
|
|
|
|
|
|
|
|
|
|
|
| DEPARTMENTS |
82,043,043 |
90,077,881 |
172,120,924 |
58,598,930 |
73,672,948 |
132,271,878 |
23,444,113 |
16,404,933 |
39,849,046 |
71.4 |
81.8 |
76.8 |
| |
|
|
|
|
|
|
|
|
|
|
|
|
| Congress of the Philippines |
663,966 |
752,804 |
1,416,770 |
528,825 |
637,691 |
1,166,516 |
135,141 |
115,113 |
250,254 |
79.6 |
84.7 |
82.3 |
| Office of the President /6 |
310,004 |
310,003 |
620,007 |
90,904 |
143,942 |
234,846 |
219,100 |
166,061 |
385,161 |
29.3 |
46.4 |
37.9 |
| Office of the Vice-President |
14,852 |
15,012 |
29,864 |
13,542 |
15,645 |
29,187 |
1,310 |
(633) |
677 |
91.2 |
104.2 |
97.7 |
| Department of Agrarian Reform |
947,734 |
1,057,080 |
2,004,814 |
326,512 |
831,314 |
1,157,826 |
621,222 |
225,766 |
846,988 |
34.5 |
78.6 |
57.8 |
| Department of Agriculture |
1,778,661 |
8,893,859 |
10,672,520 |
804,444 |
6,790,045 |
7,594,489 |
974,217 |
2,103,814 |
3,078,031 |
45.2 |
76.3 |
71.2 |
| Department of Budget and Management /5 |
2,989,752 |
77,469 |
3,067,221 |
2,972,631 |
75,201 |
3,047,832 |
17,121 |
2,268 |
19,389 |
99.4 |
97.1 |
99.4 |
| Department of Education/6 |
18,130,852 |
19,003,322 |
37,134,174 |
15,433,981 |
17,321,516 |
32,755,497 |
2,696,871 |
1,681,806 |
4,378,677 |
85.1 |
91.1 |
88.2 |
| State Universities and Colleges |
2,287,654 |
2,441,432 |
4,729,086 |
2,020,629 |
2,318,332 |
4,338,961 |
267,025 |
123,100 |
390,125 |
88.3 |
95.0 |
91.8 |
| Department of Energy |
75,973 |
64,849 |
140,822 |
61,799 |
59,015 |
120,814 |
14,174 |
5,834 |
20,008 |
81.3 |
91.0 |
85.8 |
| Department of Environment and Natural Resources |
2,365,486 |
1,053,413 |
3,418,899 |
538,402 |
1,046,284 |
1,584,686 |
1,827,084 |
7,129 |
1,834,213 |
22.8 |
99.3 |
46.4 |
| Department of Finance |
856,518 |
943,142 |
1,799,660 |
475,598 |
798,819 |
1,274,417 |
380,920 |
144,323 |
525,243 |
55.5 |
84.7 |
70.8 |
| Department of Foreign Affairs |
1,268,194 |
861,739 |
2,129,933 |
794,216 |
509,885 |
1,304,101 |
473,978 |
351,854 |
825,832 |
62.6 |
59.2 |
61.2 |
| Department of Health |
2,427,729 |
2,686,068 |
5,113,797 |
1,630,538 |
2,114,927 |
3,745,465 |
797,191 |
571,141 |
1,368,332 |
67.2 |
78.7 |
73.2 |
| Department of Interior and Local Government |
8,935,140 |
10,479,343 |
19,414,483 |
7,485,542 |
8,634,803 |
16,120,345 |
1,449,598 |
1,844,540 |
3,294,138 |
83.8 |
82.4 |
83.0 |
| Department of Justice |
856,881 |
991,658 |
1,848,539 |
624,210 |
879,982 |
1,504,192 |
232,671 |
111,676 |
344,347 |
72.8 |
88.7 |
81.4 |
| Department of Labor and Employment |
625,666 |
668,069 |
1,293,735 |
373,911 |
547,628 |
921,539 |
251,755 |
120,441 |
372,196 |
59.8 |
82.0 |
71.2 |
| Department of National Defense |
8,606,828 |
11,891,420 |
20,498,248 |
7,354,514 |
11,011,971 |
18,366,485 |
1,252,314 |
879,449 |
2,131,763 |
85.4 |
92.6 |
89.6 |
| Department of Public Works and Highways |
9,132,996 |
17,975,292 |
27,108,288 |
2,891,785 |
10,761,300 |
13,653,085 |
6,241,211 |
7,213,992 |
13,455,203 |
31.7 |
59.9 |
50.4 |
| Department of Science and Technology |
1,509,945 |
1,115,664 |
2,625,609 |
630,293 |
910,314 |
1,540,607 |
879,652 |
205,350 |
1,085,002 |
41.7 |
81.6 |
58.7 |
| Department of Social Welfare and Development |
9,104,105 |
1,976,676 |
11,080,781 |
8,193,495 |
1,790,403 |
9,983,898 |
910,610 |
186,273 |
1,096,883 |
90.0 |
90.6 |
90.1 |
| Department of Tourism |
192,768 |
157,221 |
349,989 |
113,630 |
78,583 |
192,213 |
79,138 |
78,638 |
157,776 |
58.9 |
50.0 |
54.9 |
| Department of Trade and Industry |
271,316 |
439,093 |
710,409 |
207,700 |
289,420 |
497,120 |
63,616 |
149,673 |
213,289 |
76.6 |
65.9 |
70.0 |
| Department of Transportation and Communications |
2,241,839 |
1,570,836 |
3,812,675 |
1,204,114 |
1,621,899 |
2,826,013 |
1,037,725 |
(51,063) |
986,662 |
53.7 |
103.3 |
74.1 |
| National Economic and Development Authority |
234,405 |
220,247 |
454,652 |
159,149 |
169,415 |
328,564 |
75,256 |
50,832 |
126,088 |
67.9 |
76.9 |
72.3 |
| Presidential Communications Operations Office |
95,169 |
95,538 |
190,707 |
78,499 |
94,257 |
172,756 |
16,670 |
1,281 |
17,951 |
82.5 |
98.7 |
90.6 |
| Other Executive Offices |
1,655,569 |
695,735 |
2,351,304 |
434,876 |
620,536 |
1,055,412 |
1,220,693 |
75,199 |
1,295,892 |
26.3 |
89.2 |
44.9 |
| Joint Legislative-Executive Councils |
221 |
220 |
441 |
207 |
195 |
402 |
14 |
25 |
39 |
93.7 |
88.6 |
91.2 |
| The Judiciary |
1,546,773 |
1,499,876 |
3,046,649 |
1,491,962 |
1,428,352 |
2,920,314 |
54,811 |
71,524 |
126,335 |
96.5 |
95.2 |
95.9 |
| Civil Service Commission |
116,568 |
80,354 |
196,922 |
58,752 |
71,622 |
130,374 |
57,816 |
8,732 |
66,548 |
50.4 |
89.1 |
66.2 |
| Commission on Audit |
644,970 |
676,238 |
1,321,208 |
339,200 |
861,804 |
1,201,004 |
305,770 |
(185,566) |
120,204 |
52.6 |
127.4 |
90.9 |
| Commission on Election |
203,257 |
206,006 |
409,263 |
196,682 |
(17,080) |
179,602 |
6,575 |
223,086 |
229,661 |
96.8 |
(8.3) |
43.9 |
| Office of the Ombudsman |
124,174 |
124,174 |
248,348 |
98,350 |
71,042 |
169,392 |
25,824 |
53,132 |
78,956 |
79.2 |
57.2 |
68.2 |
| Commission on Human Rights |
24,626 |
30,834 |
55,460 |
23,899 |
23,869 |
47,768 |
727 |
6,965 |
7,692 |
97.0 |
77.4 |
86.1 |
| Autonomous Region in Muslim Mindanao |
1,802,452 |
1,023,195 |
2,825,647 |
946,139 |
1,160,017 |
2,106,156 |
856,313 |
(136,822) |
719,491 |
52.5 |
113.4 |
74.5 |
| - |
|
|
|
|
|
|
|
|
|
|
|
|
| OTHERS |
29,189,697 |
29,055,338 |
58,245,035 |
29,187,058 |
28,952,869 |
58,139,927 |
2,639 |
102,469 |
105,108 |
100.0 |
99.6 |
99.8 |
| Budgetary Support to Government Owned and Controlled Corporations /8 |
693,601 |
442,968 |
1,136,569 |
693,601 |
342,516 |
1,036,117 |
- |
100,452 |
100,452 |
100.0 |
77.3 |
91.2 |
| Allotment to Local Government Units /7 |
28,496,096 |
28,612,370 |
57,108,466 |
28,493,457 |
28,610,353 |
57,103,810 |
2,639 |
2,017 |
4,656 |
100.0 |
100.0 |
100.0 |
| o.w. Metropolitan Manila Development Authority |
- |
152 |
152 |
- |
- |
- |
- |
152 |
152 |
- |
- |
- |
|
|
|
|
|
|
|
|
|
|
|
|
|
| /1 Source: Report of MDS-Government Servicing Banks as of February 2014 |
| /2 NCAs credited by MDS-Government Servicing Banks inclusive of Lapsed NCA, but net of NCAs for Trust and Working Fund |
| /3 Refers to checks issued chargeable against NCAs credited |
| /4 Percent of NCAs utilized over NCA releases |
| /5 DBM: inclusive of Grants for LGUs and 50% GSIS Premium deficiency of DepEd |
/6 ALGU: Releases on Fund 103 only (includes IRA and other releases for LGUs) |
| /7 BSGC: Total budget support covered by NCA releases (i.e. subsidy and equity). Details to be coordinated with Bureau of Treasury |
|
| |
Downloads:
FY 2014 Actual Disbursements per MDS-GSBs per Agency
PDF 
Excel 
Report on Utilization of Cash Allocations for National Government Agencies, Budgetary Support to GOCCs and LGUs PDF
Excel |
|