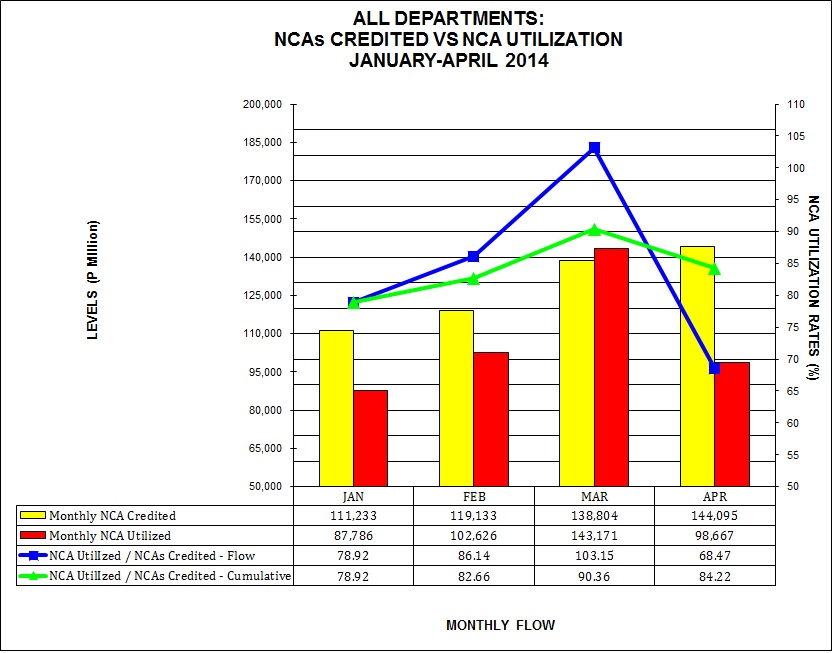
REPORT ON UTILIZATION OF CASH ALLOCATION FOR NATIONAL GOVERNMENT AGENCIES, BUDGETARY SUPPORT TO GOCCs AND LGUs /1
|
AS OF April 30, 2014 |
(In Thousand Pesos) |
|
|
|
|
|
|
|
APRIL |
|
|
|
|
|
|
|
|
|
| TOTAL |
369,169,594 |
144,095,051 |
513,264,645 |
333,582,918 |
98,667,394 |
432,250,312 |
35,586,676 |
45,427,657 |
81,014,333 |
90.4 |
68.5 |
84.2 |
| |
|
|
|
|
|
|
|
|
|
|
|
|
| DEPARTMENTS |
281,742,996 |
113,110,439 |
394,853,435 |
246,320,354 |
69,889,495 |
316,209,849 |
35,422,642 |
43,220,944 |
78,643,586 |
87.4 |
61.8 |
80.1 |
| |
|
|
|
|
|
|
|
|
|
|
|
|
| Congress of the Philippines |
2,210,945 |
790,913 |
3,001,858 |
2,111,080 |
648,031 |
2,759,111 |
99,865 |
142,247 |
242,747 |
95.5 |
81.9 |
91.9 |
| Office of the President /6 |
946,761 |
358,803 |
1,305,564 |
386,450 |
214,430 |
600,880 |
560,311 |
144,373 |
704,684 |
40.8 |
59.8 |
46.0 |
| Office of the Vice-President |
44,750 |
16,912 |
61,662 |
44,541 |
13,076 |
57,617 |
209 |
3,836 |
4,045 |
99.5 |
77.3 |
93.4 |
| Department of Agrarian Reform |
3,723,267 |
1,238,153 |
4,961,420 |
2,613,485 |
1,128,674 |
3,742,159 |
1,109,782 |
109,479 |
1,219,261 |
70.2 |
91.2 |
75.4 |
| Department of Agriculture |
14,495,192 |
5,500,866 |
19,996,058 |
12,392,410 |
1,797,547 |
14,189,957 |
2,102,782 |
3,703,319 |
5,806,101 |
85.5 |
32.7 |
71.0 |
| Department of Budget and Management /5 |
3,145,852 |
118,183 |
3,264,035 |
3,127,438 |
72,307 |
3,199,745 |
18,414 |
45,876 |
64,290 |
99.4 |
61.2 |
98.0 |
| Department of Education/6 |
59,059,387 |
25,409,415 |
84,468,802 |
56,314,545 |
20,175,536 |
76,490,081 |
2,744,842 |
5,233,879 |
7,978,721 |
95.4 |
79.4 |
90.6 |
| State Universities and Colleges |
7,284,738 |
2,786,536 |
10,071,274 |
7,162,491 |
2,324,816 |
9,487,307 |
122,247 |
461,720 |
583,967 |
98.3 |
83.4 |
94.2 |
| Department of Energy |
203,256 |
62,561 |
265,817 |
195,392 |
56,334 |
251,726 |
7,864 |
6,227 |
14,091 |
96.1 |
90.0 |
94.7 |
| Department of Environment and Natural Resources |
5,677,037 |
1,712,644 |
7,389,681 |
5,517,617 |
712,602 |
6,230,219 |
159,420 |
1,000,042 |
1,159,462 |
97.2 |
41.6 |
84.3 |
| Department of Finance |
2,889,699 |
5,090,386 |
7,980,085 |
2,300,355 |
1,047,034 |
3,347,389 |
589,344 |
4,043,352 |
4,632,696 |
79.6 |
20.6 |
41.9 |
| Department of Foreign Affairs |
2,979,694 |
756,566 |
3,736,260 |
2,276,591 |
289,494 |
2,566,085 |
703,103 |
467,072 |
1,170,175 |
76.4 |
38.3 |
68.7 |
| Department of Health |
8,458,743 |
3,349,060 |
11,807,803 |
7,441,025 |
1,896,345 |
9,337,370 |
1,017,718 |
1,452,715 |
2,470,433 |
88.0 |
56.6 |
79.1 |
| Department of Interior and Local Government |
29,958,847 |
15,667,446 |
45,626,293 |
28,483,037 |
9,081,573 |
37,564,610 |
1,475,810 |
6,585,873 |
8,061,683 |
95.1 |
58.0 |
82.3 |
| Department of Justice |
2,891,212 |
1,103,954 |
3,995,166 |
2,759,545 |
746,475 |
3,506,020 |
131,667 |
357,479 |
489,146 |
95.4 |
67.6 |
87.9 |
| Department of Labor and Employment |
2,117,306 |
1,072,073 |
3,189,379 |
1,925,748 |
484,815 |
2,410.563 |
191,558 |
587,258 |
778,816 |
91.0 |
45.2 |
75.6 |
| Department of National Defense |
38,164,262 |
12,198,843 |
50,363,105 |
37,524,388 |
11,054,946 |
48,579,334 |
639,874 |
1,143,897 |
1,783,771 |
98.3 |
90.6 |
96.5 |
| Department of Public Works and Highways |
44,992,567 |
20,048,056 |
65,040,623 |
29,637,695 |
9,192,506 |
38,830,201 |
15,354,872 |
10,855,550 |
26,210,422 |
65.9 |
45.9 |
75.6 |
| Department of Science and Technology |
3,567,314 |
1,494,045 |
5,061,359 |
3,389,012 |
480,570 |
3,869,582 |
178,302 |
1,013,475 |
1,191,777 |
95.0 |
32.2 |
76.5 |
| Department of Social Welfare and Development |
25,480,420 |
3,234,961 |
28,715,381 |
20,463,396 |
1,166,090 |
21,629,486 |
5,017,024 |
2,068,871 |
7,085,895 |
80.3 |
36.0 |
75.3 |
| Department of Tourism |
507,767 |
183,162 |
690,929 |
417,353 |
132,644 |
549,997 |
90,414 |
50,518 |
140,932 |
82.2 |
72.4 |
79.6 |
| Department of Trade and Industry |
1,094,535 |
333,248 |
1,427,783 |
974,899 |
177,251 |
1,152,150 |
119,636 |
155,997 |
275,633 |
89.1 |
53.2 |
80.7 |
| Department of Transportation and Communications |
5,969,236 |
2,185,088 |
8,154,324 |
4,705,908 |
1,572,294 |
6,278,202 |
1,263,328 |
612,794 |
1,876,122 |
78.8 |
72.0 |
77.0` |
| National Economic and Development Authority |
722,570 |
338,616 |
1,061,186 |
597,406 |
185,114 |
782,520 |
125,164 |
153,502 |
278,666 |
82.7 |
54.7 |
73.7 |
| Presidential Communications Operations Office |
279,085 |
189,158 |
468,243 |
270,327 |
91,236 |
361,563 |
8,758 |
97,922 |
106,680 |
96.9 |
48.2 |
77.2 |
| Other Executive Offices |
3,050,997 |
2,277,654 |
5,328,651 |
1,880,154 |
574,998 |
2,455,152 |
1,170,843 |
1,702,656 |
2,873,499 |
61.6 |
25.2 |
46.1 |
| Joint Legislative-Executive Councils |
662 |
360 |
1,022 |
662 |
257 |
919 |
- |
103 |
103 |
100.0 |
71.4 |
89.9 |
| The Judiciary |
4,620,017 |
1,633,721 |
6,253,738 |
4,609,794 |
1,475,701 |
6,085,495 |
10,223 |
158,020 |
168,243 |
99.8 |
90.3 |
97.3 |
| Civil Service Commission |
346,324 |
137,100 |
483,424 |
344,012 |
61,481 |
405,493 |
2,312 |
75,619 |
77,931 |
99.3 |
44.8 |
83.9 |
| Commission on Audit |
1,991,505 |
712,035 |
2,703,540 |
1,672,245 |
607,792 |
2,280,037 |
319,260 |
104,243 |
423,503 |
84.0 |
85.4 |
84.3 |
| Commission on Election |
625,584 |
1,237,738 |
1,863,322 |
622,162 |
1,069,909 |
1,692,071 |
3,422 |
167,829 |
171,251 |
99.5 |
86.4 |
90.8 |
| Office of the Ombudsman |
377,889 |
151,170 |
529,059 |
377,725 |
123,404 |
501,129 |
164 |
27,766 |
27,930 |
100.0 |
81.6 |
94.7 |
| Commission on Human Rights |
81,599 |
28,103 |
109,702 |
80,422 |
19,969 |
100,391 |
1,177 |
8,134 |
9,311 |
98.6 |
71.1 |
91.5 |
| Autonomous Region in Muslim Mindanao |
3,783,977 |
1,692,910 |
5,476,887 |
3,701,044 |
1,214,244 |
4,915,288 |
82,933 |
478,666 |
561,599 |
97.8 |
71.1 |
89.7 |
| - |
|
|
|
|
|
|
|
|
|
|
|
|
| OTHERS |
87,426,598 |
30,984,612 |
118,411,210 |
87,262,564 |
28,777,899 |
116,040,463 |
164,034 |
2,206,713 |
2,370,747 |
99.8 |
92.9 |
98.0 |
| Budgetary Support to Government Owned and Controlled Corporations /8 |
1,824,847 |
54,097 |
1,878,944 |
1,661,710 |
47,933 |
1,709,643 |
163,137 |
6,164 |
169,301 |
91.1 |
88.6 |
91.0 |
| Allotment to Local Government Units /7 |
85,601,751 |
30,935,714 |
116,537,465 |
85,600,854 |
28,729,966 |
114,330,820 |
897 |
2,205,748 |
2,206,645 |
100.0 |
92.9 |
98.1 |
| o.w. Metropolitan Manila Development Authority |
152 |
403,400 |
403,552 |
152 |
155,862 |
156,014 |
- |
247,538 |
247,538 |
100.0 |
38.6 |
38.7 |
|
|
|
|
|
|
|
|
|
|
|
|
|
| /1 Source: Report of MDS-Government Servicing Banks as of April 2014 |
| /2 NCAs credited by MDS-Government Servicing Banks inclusive of Lapsed NCA, but net of NCAs for Trust and Working Fund |
| /3 Refers to checks issued chargeable against NCAs credited |
| /4 Percent of NCAs utilized over NCA releases |
| /5 DBM: inclusive of grants from AECID |
| /6 ALGU: Releases on IRA and special shares |
| /7 BSGC: Total budget support covered by NCA releases (i.e. subsidy and equity). Details to be coordinated with Bureau of Treasury |
|
| |
Downloads:
FY 2014 Actual Disbursements per MDS-GSBs per Agency
PDF 
Excel 
Report on Utilization of Cash Allocations for National Government Agencies, Budgetary Support to GOCCs and LGUs PDF
Excel |
|